
A Flood Data Visualization Tool and Suggestions
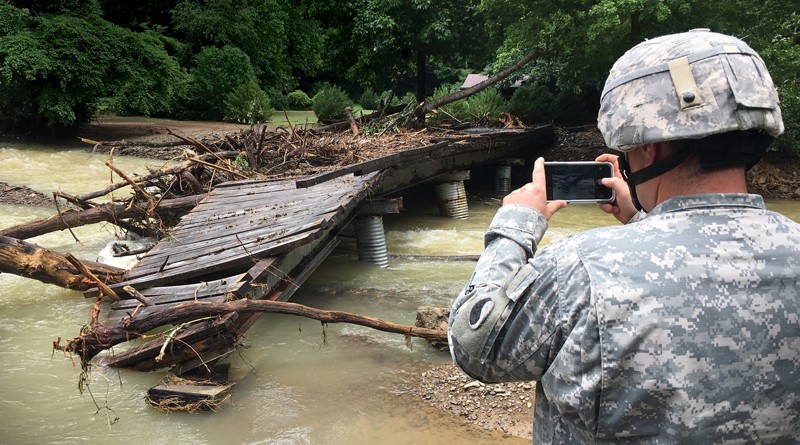
The ongoing challenge of repeated flooding affects countless communities across the United States, particularly low-income areas and communities of color, which often lack the resources to mitigate these impacts. An interactive data visualization tool highlights Repetitive Loss Properties (RLPs), showcasing regions with multiple flood insurance claims under the National Flood Insurance Program (NFIP). This tool serves as a vital resource for understanding flooding trends and identifying areas in urgent need of support. It emphasizes the necessity for commonsense reforms to the NFIP that can help communities adapt to the growing challenges posed by climate change.
Key policy recommendations include updating the NFIP’s floodplain development standards, ensuring flood-risk maps are accurate and reflective of climate impacts, and making flood insurance more affordable for low- and moderate-income households. Additionally, the need for transparency in flood risk information is underscored, advocating for the right of homebuyers and renters to access flood history data. Increasing funding for flood risk reduction projects and streamlining access to these funds are also critical steps in protecting vulnerable communities from future flooding events. By implementing these changes, stakeholders can foster safer and more resilient living environments for all residents.